Monitor your Data Usage from the Dashboard

Keeping track of your project's data usage is crucial to avoid unexpected overages and to ensure your projects run smoothly. That’s why we're happy to share some additions to the DatoCMS Dashboard that are set to make your life easier when it comes to monitoring data usage of your projects.
We’ve heard your feedback that doing that on a project basis is tiresome. And yes, we do send out emails when your projects reach a certain threshold, but they are often overseen, and don’t always reach the right people.
With that in mind, we’ve decided to give more information in the Dashboard, where project and organization owners already manage many aspects of their projects, including billing.
Overage Status Panel
First, we've added a new Overage Status panel in the Plan and Billing page, providing a quick summary of your user-driven metrics: Bandwidth (traffic) usage, API calls, Video streaming.
This panel will show you at a glance how things are going in the current month:
🟢 So far, so good: Your usage is within the limits of your plan.
🟡 Your attention is needed: You're nearing the limits of your plan and may incur overage charges if you exceed them.
🔴 Limits exceeded: you’ve already gone over your limit and we’ll bill you for the additional usage after the month ends.
If your overage status is either "yellow" or "red", we'll show a notification badge next to the "Plan and Billing" link in the navigation bar.
Clicking on the panel will take you to the new Data Usage page for more detailed information, and you'll also have the option to get in touch with our Sales team to discuss your needs, as your projects scale.
Data Usage Page
The new Data Usage page provides an in-depth look at how much data your projects are consuming.
The page includes charts that show your usage over time, segmented by resource type and individual projects. You can view your usage data by month (compared to the previous month) or cumulative for the last 30 days (compared to the previous 30 days)
We also provide the historical data for as long as you’ve been with us, if you want to check trends over time, or you’re feeling nostalgic 😀
Look into the future 🔮
We've also added a forecast feature that predicts your usage at the end of the current month, so you can proactively manage your resources and avoid unexpected overage charges. This is extremely helpful to intercept potential implementation errors or unoptimized assets that might cause unwanted costs.
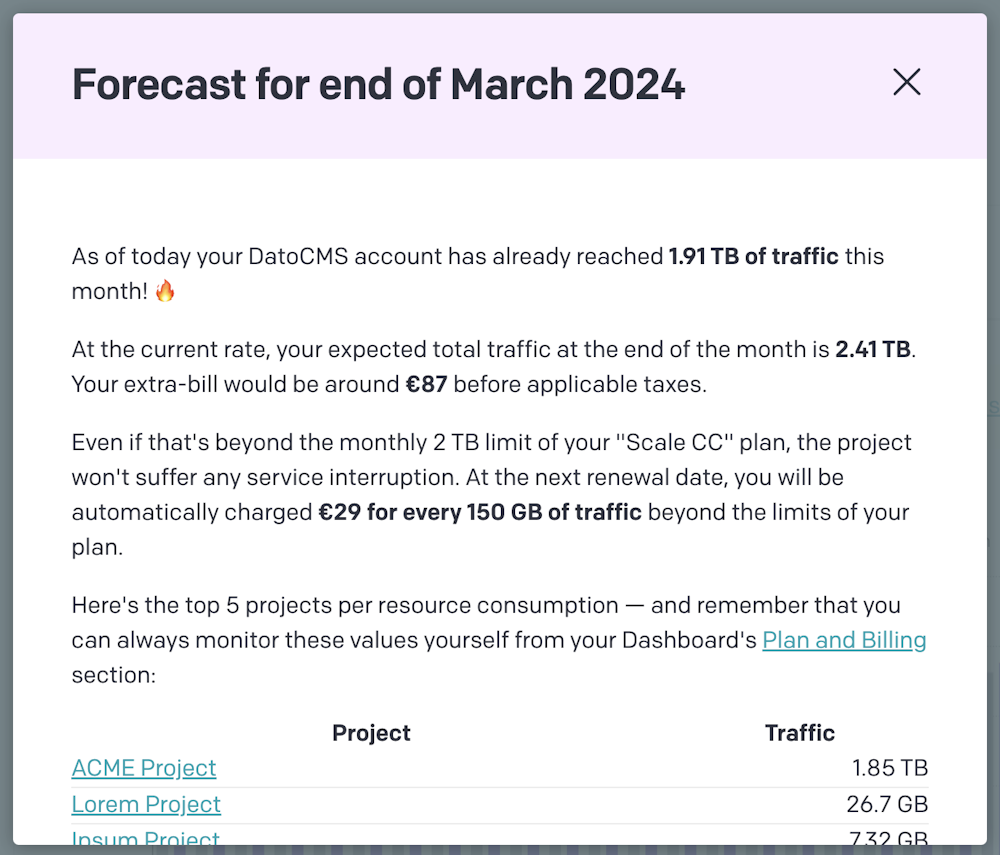
Specifically, you can also get a list of how much each of your projects are contributing to your metrics. If you have permission to view individual projects, you'll see a direct link to the Project Usage page for each project. This allows you to dive even deeper into the usage details for a specific project.
Wrapping things up
Finally, we've renamed the Resource Consumption panel to Plan Limits and Usage to better reflect its purpose. This panel now focuses solely on your plan limits, such as the number of users and projects allowed.
We hope these improvements will make it easier for you to monitor and manage data usage across all of your projects. If you have any questions or feedback, please don't hesitate to reach out to us!

